Contents
Generating 100 tokens with GPT-2 on my laptop needs about 60 ms of math. It takes 2,054 ms.
That is 3% of the time doing the one thing the chip is built for. The other 97% it waits. This post is about what it waits for, and what you can do about it.
I found this while building a small inference engine from scratch (repo): GPT-2, a KV cache, then batching. The same pattern kept repeating. Every fix worked, and every fix created the next problem. So that is how the post is built. Each section starts from the problem the previous one left open, and ends by naming the next.
Every number is GPT-2 small on an Apple M1, CPU, fp32, unless I say otherwise. If you already know the roofline model, skip to section 4. Part 1 builds the generation loop and the KV cache this post starts from.
1. The Problem: Where Two Seconds Go
Here is the measurement. A 128-token prompt, 100 tokens out, GPT-2 small.
|-- prefill --|---------- decode: 99 more tokens ----------|
     74 ms             99 x 20 ms = 1,980 ms

total = 74 + 1,980 = 2,054 ms
Decode is 96% of the wait.
A user feels this as two different waits. First the model thinks: the time until the first token appears, called TTFT. Then it types: the gap between each token after that, called TPOT. For anything longer than a sentence, the typing dominates.
So the question isn’t how to read a prompt faster. It’s why each token costs 20 ms when the math behind it is tiny. One token needs about 0.25 GFLOP. My chip does roughly 900 GFLOP every second (I measured it). That is a third of a millisecond.
Fast chip, slow tokens. Something else is the bottleneck.
The obvious suspect is the chip itself. Let’s test that first.
2. First Attempt: A Faster Chip
If the chip is the bottleneck, a faster chip should help. Before buying one, look at what a decode step actually does.
GPT-2 small has 124M weights, 4 bytes each: about 0.5 GB. To make one token, the chip reads every weight once and does two FLOPs with it, a multiply and an add.
I measured two numbers on my M1: 907 GFLOP/s of math and 45.8 GB/s of memory bandwidth. A big matmul and a big copy, not the spec sheet.
| One decode step | Calculation | Time |
|---|---|---|
| Math | 0.25 GFLOP / 907 GFLOP/s | 0.3 ms |
| Memory | 0.5 GB / 45.8 GB/s | 11 ms |
Memory takes 40x longer than math. The chip spends nearly the whole step waiting for weights to arrive. A chip twice as fast turns 0.3 ms into 0.15 ms and leaves the 11 ms alone.
I measured 20 ms, not 11. The engine streams weights at about 23 GB/s, half the peak. My guess is overhead from layernorm, attention and many small ops. I haven’t profiled it.
More compute doesn’t help. Decode is waiting for data, not for math.
That rules out the obvious fix, but it leaves a better question. When is a step limited by math, and when by memory? If there is a rule, it should also tell us what to try instead.
3. The Real Constraint: Two Ceilings
Every step has two costs, and the slower one sets the time.
math time   = FLOPs / compute speed
memory time = bytes moved / memory bandwidth
Divide the FLOPs by the bytes and you get the step’s arithmetic intensity: how much math it does for each byte it moves. The chip has a matching number, the ridge point: compute speed divided by bandwidth. On my M1 that is 907 / 45.8 = 19.8 FLOP/byte.
Below the ridge, a step is memory-bound and the chip waits for data. Above it, the step is compute-bound and the chip is busy.
Decode does 0.25 GFLOP over 0.5 GB of weights: 0.5 FLOP/byte. Forty times below the ridge.
Now take prefill, the step that reads the 128-token prompt. It pushes all 128 tokens through in one pass, so every weight read is used 128 times. That is 32 GFLOP over the same 0.5 GB: 64 FLOP/byte, above the ridge. Math takes 35 ms, memory still takes 11 ms.
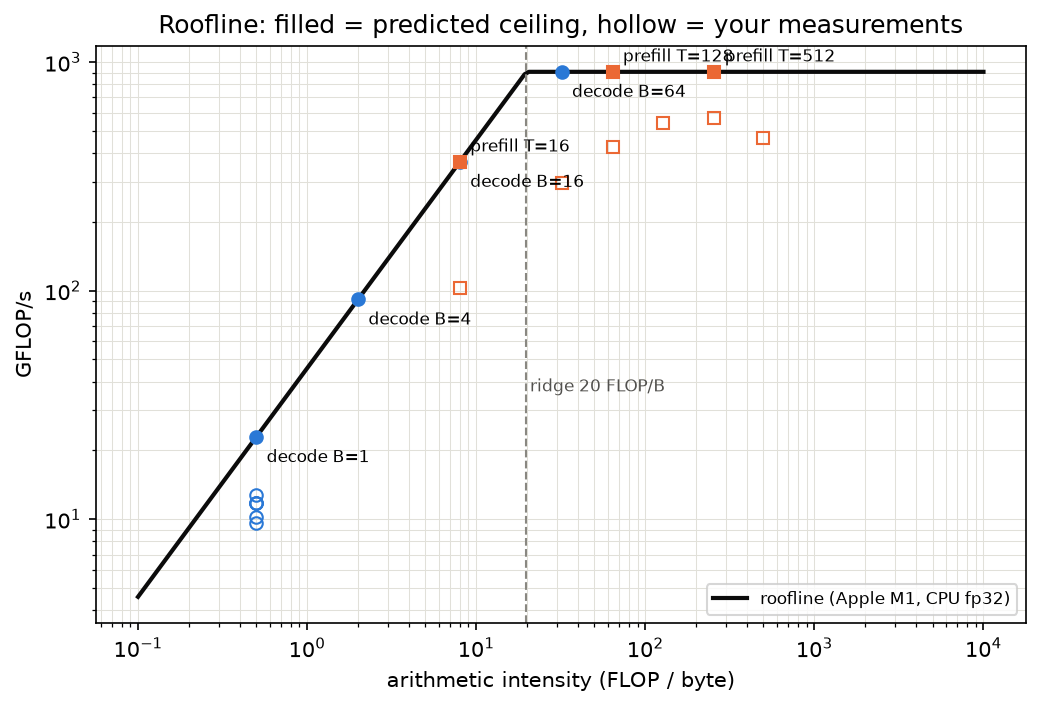
Same model, same weights, opposite bottlenecks.
Look at what changed between the two. Nothing about the model. Only the number of tokens sharing each weight read. A 16-token prompt has intensity 8, still left of the ridge. A 128-token prompt has 64, well right of it. Prefill with T tokens has intensity 0.5 x T.
A step’s speed depends on how many tokens share each weight read.
That is the lever. Decode only has one token per user per step. So where do we find more tokens to share the weights with? From other users.
4. Second Attempt: Share the Weights Across Users
A bus costs the same to drive with 1 passenger or 40. If the weights are the expensive trip, make each trip carry more people.
Serve B users in one decode step. The weights are read once: still 0.5 GB, still 11 ms. The math grows with B. So the intensity is 0.5 x B, and the step stays memory-bound until B reaches the ridge. That predicts a knee near B = 40.
I ran it with 32-token prompts and took the median step time over 20 decode steps.
| Batch size | Step time (ms) | Total tok/s | Per-user tok/s |
|---|---|---|---|
| 1 | 17.6 | 57 | 57 |
| 2 | 40.4 | 49 | 25 |
| 4 | 40.3 | 99 | 25 |
| 8 | 38.0 | 210 | 26 |
| 16 | 39.7 | 403 | 25 |
| 32 | 53.1 | 602 | 19 |
From B = 2 to B = 16 the step time stays near 40 ms while total throughput climbs from 49 to 403 tok/s. Eight times the users for the same step. At B = 32 the step finally slows, to 53 ms.
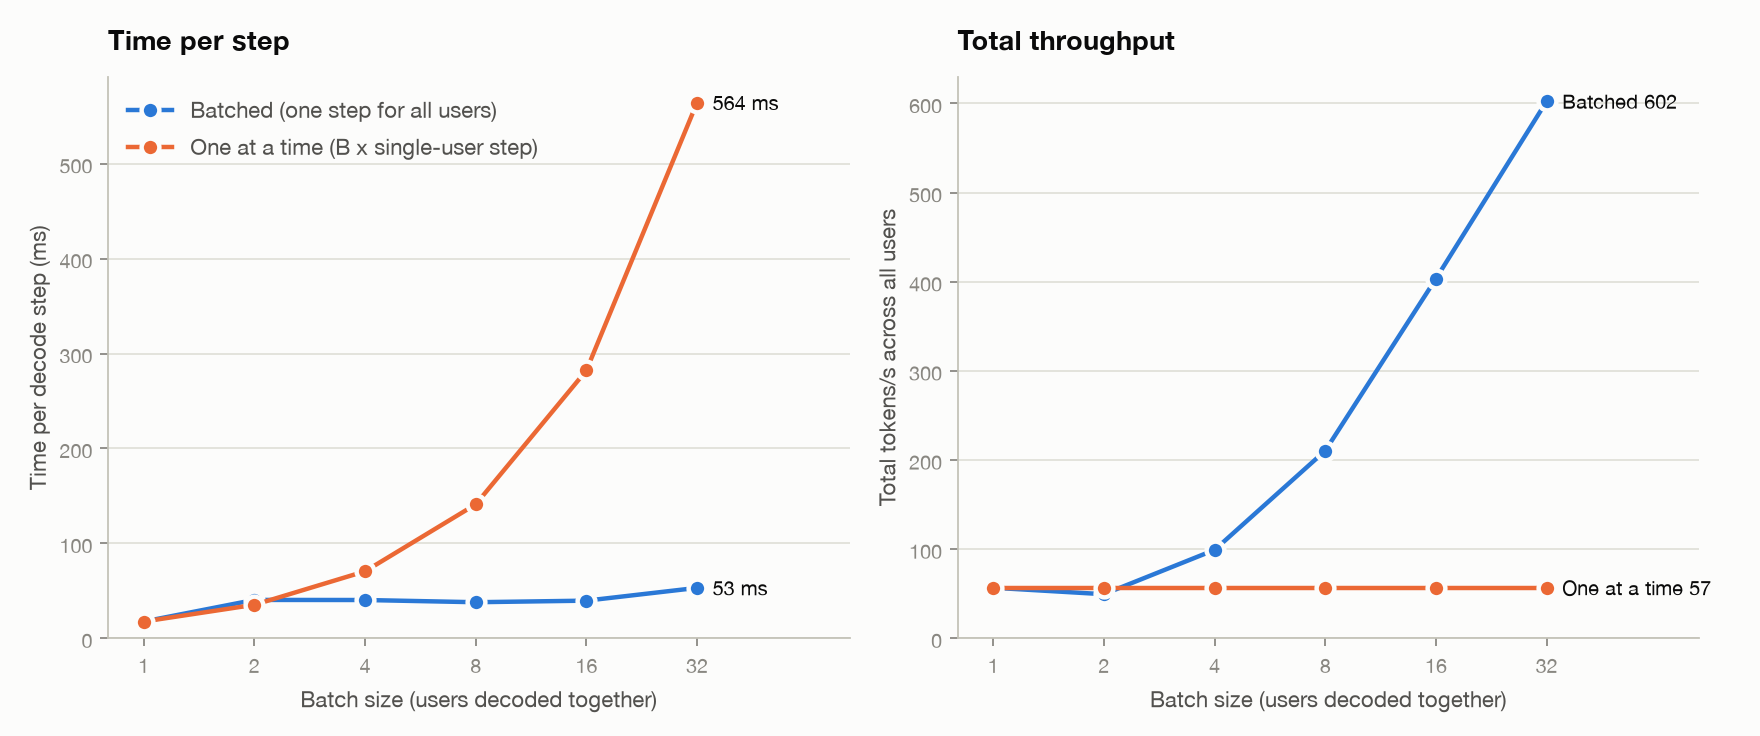
Two things don’t match the story. B = 1 is much faster than the flat region after it, and I don’t have an explanation yet. And I predicted the knee at B = 40 but saw it between 16 and 32. My guess is that I left out the KV cache reads and the non-matmul ops, which add time that is not shared across users. My cache also grows with a torch.cat on every step, which copies every user’s K and V each time.
Below the ridge, batching is nearly free.
On a GPU the ridge sits much higher. An H100 is roughly 300 FLOP/byte (approximate, from spec-sheet figures), so it takes a batch in the hundreds to use the chip fully. That is why serving engines fight so hard to batch requests.
But notice what the table doesn’t show. Every extra user in that batch brought something with them that isn’t shared.
5. The Catch: Every User Brings Their Own Cache
The weights are shared between users. The KV cache is not.
To generate token n+1, attention needs the K and V vectors of every earlier token. Recomputing them each step is the quadratic naive loop I started this project with. So each user keeps their own, in every layer. The cost per token:
KV bytes per token = 2 x layers x kv_heads x head_dim x bytes
KV total           = KV per token x tokens x batch
The 2 is for K and V. For GPT-2 small in fp32 that is 2 x 12 x 12 x 64 x 4 = 73,728 bytes, about 72 KB per token. At 1,024 tokens one user costs 75 MB. Thirty-two users cost 2.4 GB.
The model weights are 0.5 GB. The cache is five times bigger than the model.
Now a real model. Llama-3-8B in fp16 has 32 layers, 8 KV heads and head_dim 128. That is 128 KB per token, or 1.07 GB for one user at 8k context. On an 80 GB GPU, 16 GB goes to weights. That leaves about 64 GB, so roughly 59 users, ignoring activations and overhead.
Why only 8 KV heads? The model has 32 query heads, but groups of them share one KV head. That is grouped-query attention (GQA). Here is the same model without it:
| 8k context, 64 GB for cache | KV per token | KV per user | Users |
|---|---|---|---|
| Llama-3-8B with GQA (8 KV heads) | 128 KB | 1.07 GB | 59 |
| Same model, 32 KV heads (hypothetical) | 512 KB | 4.3 GB | 14 |
These Llama numbers are computed from the model’s published config. I did not run them.
GQA cuts the cache 4x, which means 4x more users on the same GPU.
On my laptop, compute stops the batch. On a GPU, the KV cache does.
So memory sets a ceiling on the batch. But running right at the ceiling isn’t automatically the right choice. Who decides how big is too big?
6. The Measure: Goodput, Not Throughput
Throughput counts tokens per second across all users. It always rewards the biggest batch. But no user feels throughput. They feel TTFT and TPOT.
So set a service-level objective (SLO), a latency promise, and count only the tokens from requests that meet it. That number is goodput. For illustration I use TPOT of 45 ms or less. The threshold is my choice, not a standard.
Apply it to the batching table:
| Batch size | TPOT (ms) | Throughput (tok/s) | Goodput (tok/s) |
|---|---|---|---|
| 16 | 39.7 | 403 | 403 |
| 32 | 53.1 | 602 | 0 |
B = 32 produces the most tokens, but every user waits 53 ms for each one. It misses the SLO, so its goodput is zero. B = 16 is the right batch size.
This turns batch size from a guess into a measurement: sweep it, find where TPOT crosses the limit, and cap the scheduler there.
TTFT adds a second constraint. A long prompt that lands in the middle of a busy batch makes everyone else’s decode wait for its prefill, and their TPOT spikes. I haven’t measured this yet.
More throughput is worthless if the extra tokens arrive too late to count.
That gives a rule for a batch that starts together and ends together. Real traffic doesn’t behave like that.
What’s Still Broken
Look back along the chain. Tokens were slow, so I tried a faster chip, and it didn’t help. The two-ceilings rule showed decode was waiting on memory. Batching fixed the wait and created a cache problem. GQA stretched the cache, and goodput told me when to stop.
Every fix moved the bottleneck instead of removing it. That is the real shape of inference work: you never fix the slow thing, you find the next one.
Three problems are still open, and they are what I’m building next:
- Users who arrive and leave at different times. A static batch waits for its slowest user. Continuous batching lets users join and leave between steps.
- Cache memory. My cache grows with a torch.cat on every step, copying every user’s K and V each time. A better allocator should avoid that and handle users of different lengths.
- Long prompts. One long prefill stalls everyone else’s decode. I want to measure it, then try splitting prefill into chunks.
If you spot a number that looks wrong, I’d like to know. Everything here is GPT-2 small on an Apple M1 (CPU, fp32), except the Llama figures, which are computed from published configs, not run.
Code, tests and benchmarks for every step: github.com/sanjay23singh/llm-inference-from-scratch.